Fun Times with C++ Custom Allocators
I recently wrote a statistics-gathering, segmented free-list allocator for C++ for my Systems class. It was lots of fun, very insightful, and exposed a couple of fun issues I thought I’d share. I’m not sure if I can publicize the github repo for the allocator, but it’s what you’d expect a simple free-list allocator to be. We also read lots of cool papers listed on the course site. Check them out!
The Point of the Allocator
I described the allocator we implemented as a “statistics-gathering, segmented free-list allocator”. So what does that mean? Let’s break it down.
- Statistics-gathering - Our allocator collects information about the memory
requests made and amount of memory in use and any given time step
t. Specifically, we care about the cumulative number of bytes requested and number of bytes allocated at any time stept, and the max of each of those stats over all time steps. - Segmented free-list - Free-list allocators place freed blocks of memory
back into a data structure to be reused by calls to
mallocbefore allocating a new chunk in the heap. Segmented refers to the categorization of objects in this data structure into discrete subsets based on size of the object. All this is to say that each size class of allocated object is given a unique free-list to allow for a sort of best-fit allocator that falls back on allocating a new chunk from the heap if no free blocks of the given class exist in its free-list.
The segmentation of the free-lists is an implementation detail that allows for decent efficiency. The reasoning for gathering statistics may be less obvious. Wait for a follow-up post on conservative garbage collection for how we end up using this information.
An important point to highlight is that we store this per-object metadata in haeder structs immediately preceding each object in the heap. Here’s a sketch of what the heap may look like after an allocation:
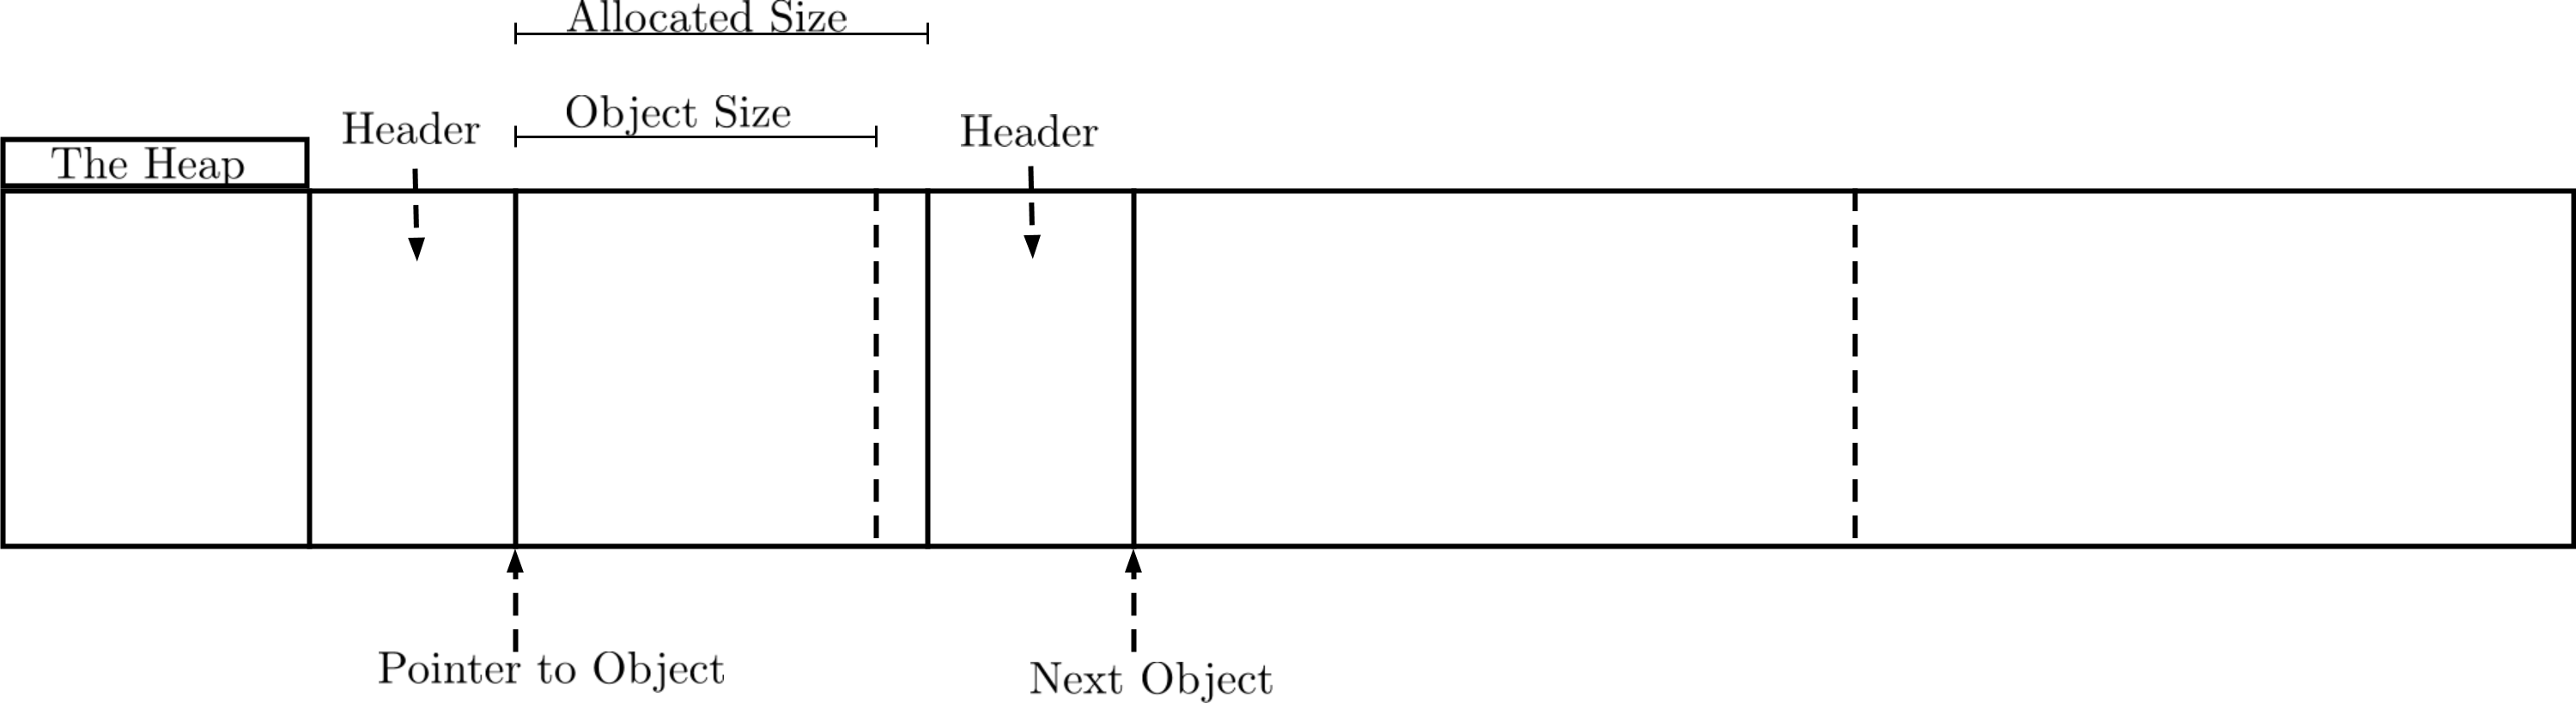
So every allocated object has a constant space-overhead for its associated
header. This is small for our custom allocator, but can still be larger than
small heap-allocated objects. Managed languages like Java have even larger
headers containing things such as synchronization primitives, so they use clever
tricks to avoid allocating a header larger than the object it tracks. We’re not
going to concern ourselves with this. Check out thin
locks
if you’re interested in learning more.
So that’s the high-level of our allocator! We protect the mmap‘d heap with a
global lock to allow for safe, multithreaded allocations, and otherwise we are
off to the races!
Re-linking Programs to Use the Allocator
Suppose you would like to test your custom allocator against some precompiled
binaries, using your allocator in a terminal session executing bash commands.
*NIX operating systems make this simple to do!
On Linux systems:
- The
LD_PRELOADenvironment variable loads a specified dynamic/shared library before loading any other code upon launching a binary.
On Mac:
- The
DYLD_INSERT_LIBRARIESenvironment variable performs the same function.
Note that you may need to set LD_LIBRARY_PATH to the directory containing your
allocator’s shared library to get things to work.
Now let’s see this in action running less in a shell:
| PID | USER | PR | NI | VIRT | RES | %CPU | %MEM | TIME+ | S | COMMAND |
|---|---|---|---|---|---|---|---|---|---|---|
| 19321 | usernm | 20 | 0 | 1049.7m | 4.2m | 0.0 | 0.1 | 0:00.00 | S | less |
It should be obvious that less doesn’t require 1GB of memory. This shows up
because we statically allocate a 1GB heap when we load our allocator,
regardless of the memory requirements of the program. It’s fine though because
virtual memory is magic and 64-bit address spaces mean we can allocate a 1GB
heap per-process and not worry about it unless we actually need to use the full
heap.
Still, we’re able to run bash commands with evidence that our custom allocator
is being used! It will also be apparent that your allocator is being used if
you’ve made a mistake, in which case it’s likely you’ll coredump. Yay.
Depending on your implementation strategy, you may experience some noticeable,
and less-desirable properties of your allocator. Since you’ve caught malloc
calls, allocations should be using your system. It should be safe to assume a
well-behaved program will pass pointers to free that live in your heap with a
valid header object immediately preceding it in memory. If you want to verify
this is the case, you can linearly search a linked-list of allocated objects to
make sure it’s not an invalid free, but this comes at a performance cost. The
same approach could be used to catch double frees.
When Things Should Work But Everything Is the Worst
What happens when you decide to trust this assumption? Misbehaved malloc and
free calls can cause extra trouble for our system because of our in-heap
header objects. If we do nothing to protect against an invalid free, the state
information we maintain in headers can overwrite valid objects in our heap. So
maybe you want to add some protection. Maybe you like living on the edge though.
Let’s graduate to running GTK applications. I’ve tested nautilus and
wireshark-gtk, but I suspect anything that can fit in our fixed-size heap will
do. And by “will do” I mean will eventually coredump. The issue seems to be
stressed heavily when creating and destroying short-lived threads.
PID: 22577 (nautilus)
UID: 1000 (usernm)
GID: 1000 (usernm)
Signal: 11 (SEGV)
Timestamp: Sun 2017-02-26 17:41:40 EST (1 weeks 2 days ago)
Command Line: nautilus
Executable: /usr/bin/nautilus
Control Group: /user.slice/user-1000.slice/user@1000.service/gnome-terminal-server.service
Unit: user@1000.service
User Unit: gnome-terminal-server.service
Slice: user-1000.slice
Owner UID: 1000 (usernm)
Boot ID: 774881d4e90d4110b2622c613ad8b731
Machine ID: bab7914944494565bde60a645e838c11
Hostname: hostnm
Storage: /var/lib/systemd/coredump/core.nautilus.1000.774881d4e90d4110b2622c613ad8b73
Message: Process 22577 (nautilus) of user 1000 dumped core.

Stack trace of thread 22577:
#0  0x00007f78cb2e4bd4 _ZN10StatsAllocI8MmapHeapILm1073741824EEE4freeEPv (libstatsalloc.so)
#1  0x00007f78cb2e469d xxfree (libstatsalloc.so)
#2 0x00007f78cb2e39e5 customfree (libstatsalloc.so)
#3 0x00007f78c7ca1736 n/a (libglib-2.0.so.0)
#4 0x00007f78c7ca28ee g_slice_free1 (libglib-2.0.so.0)
#5 0x00007f78c7c8160a n/a (libglib-2.0.so.0)
#6 0x00007f78c7c845d0 g_main_context_dispatch (libglib-2.0.so.0)
#7 0x00007f78c7c84810 n/a (libglib-2.0.so.0)
#8 0x00007f78c7c848bc g_main_context_iteration (libglib-2.0.so.0)
#9 0x00007f78c823e52d g_application_run (libgio-2.0.so.0)
#10 0x00000000004293ba n/a (nautilus)
#11 0x00007f78c739b291 __libc_start_main (libc.so.6)
#12 0x000000000042941a n/a (nautilus)

...
Here we see that nautilus segfaults in a call to free caught by our custom
libstatsalloc.so shared library. Some other coredumps showed a bunch of
pthreads calls in the stack trace, which in combination with short-lived
threads eventually led me to
this really fun bug in
glib < 2.25. Locally building and linking against latest glib didn’t solve
the issue though. So, despite it being right there in the coredump stack trace,
it took me a long time (days) to look into g_slice_free1 and the associated
g_slice_allocator.
Long story short, glib memory slices can delegate freeing pointers to the
system allocator, when those pointers were allocated by a custom allocator
internal to glib itself. So that’s pretty anticlimactic. Fortunately, you can
run your binary with G_SLICE=always-malloc to always defer to the system
allocator, guaranteeing you only free pointers that you malloc yourself.
After a long time spent debugging my custom allocator, it turned out the
allocator was fine all along, and my assumptions were incorrect.
Summary
That was a long-winded way of highlighting a couple snags I ran into implementing my own custom allocator. It’s fun to watch your system happily trudge along, knowing that it is relying on an allocator you wrote by hand, and are fully aware of its limitations. Hand-tuned allocators might still be magic, but the core functionality of an allocator is pretty straight forward. I mentioned there will be a follow up related to conservative garbage collection. Check that out once it’s posted to see something neat this allows us to do.